

Audit traces
When someone asks "why did the agent say that?", the trace is the answer.
Where to find it
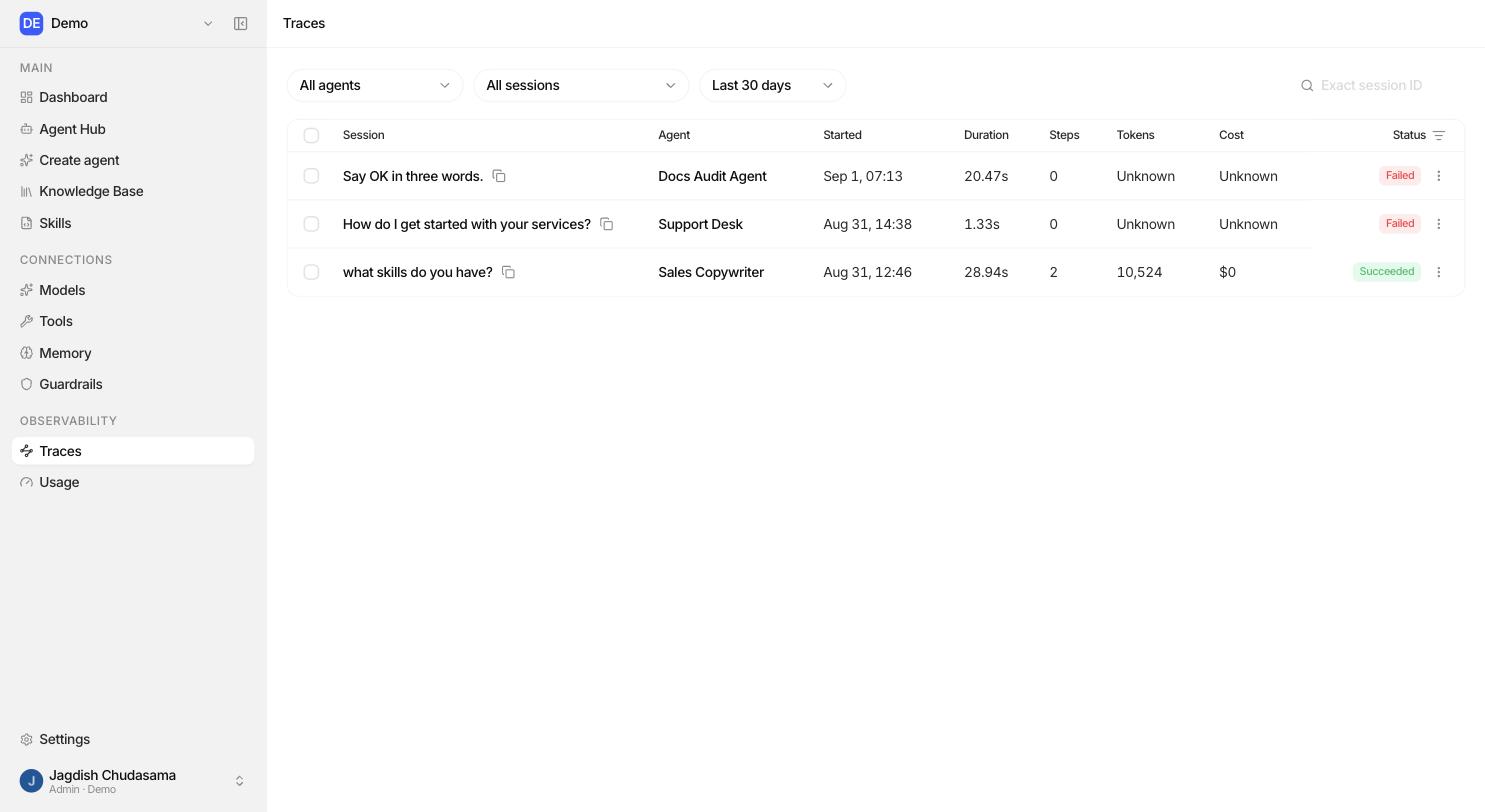
Sidebar → Traces. You get a list of runs. Click one to open its detail.
The run list
Each row shows the agent, who ran it, the status, when it started, how long it took, how many tokens it used and what it cost.
By default you see your own runs. Whether you see the whole organization depends on your permissions, described below.
The step waterfall
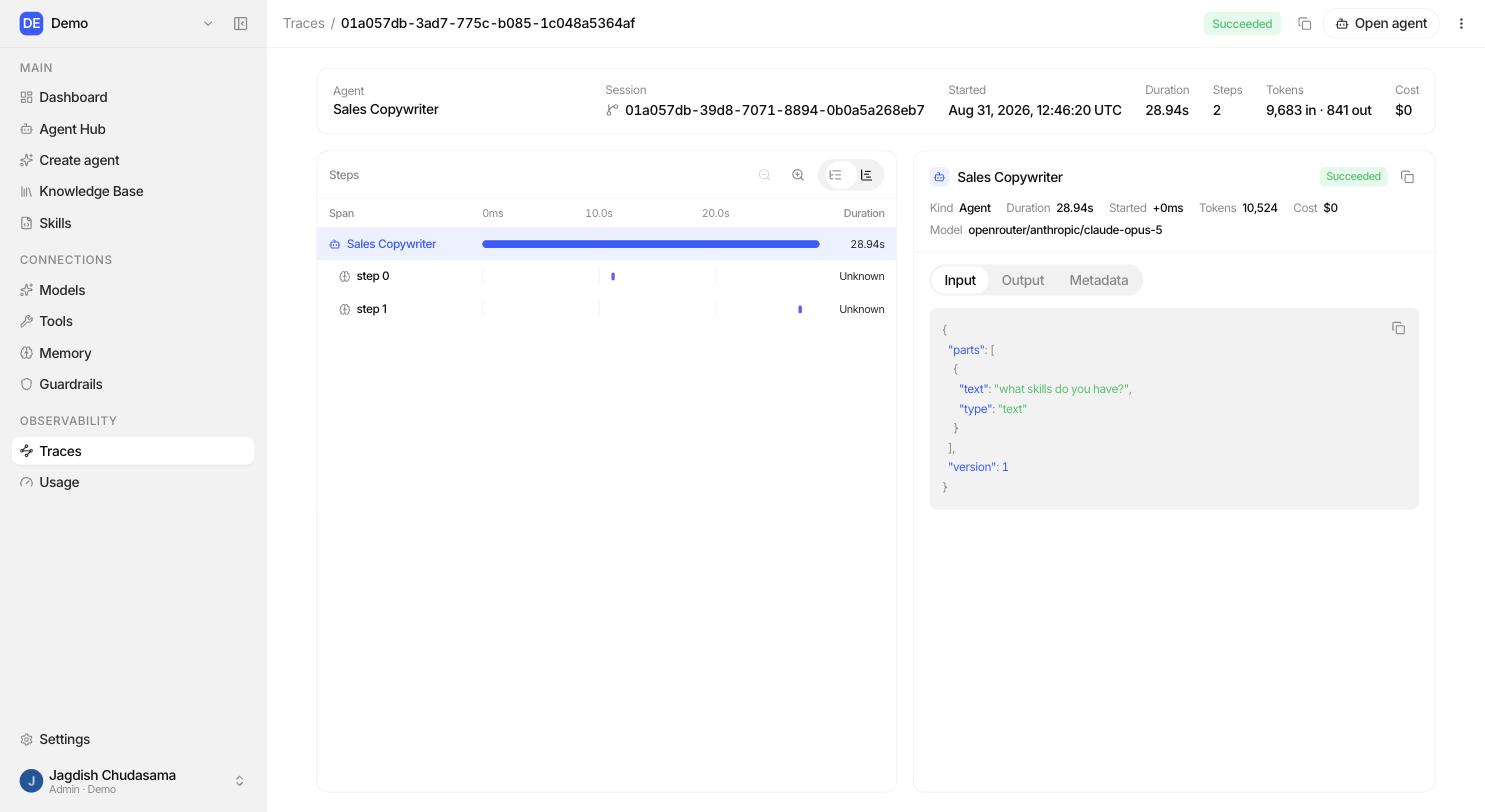
Open a run and you get its steps in wall clock order, nested so you can see what happened inside what.
| Step type | What it records |
|---|---|
| llm | A model call: input tokens, output tokens, cached tokens, and cost in USD |
| tool | A tool call: which tool, its arguments and its result |
| retrieval | A knowledge base search: the query and what came back |
| guardrail | A safety check: which stage, and the verdict |
Every step also carries a start time, an end time (so duration is exact), an attempt number for retries, and an error type and message when it failed.
Two separate permissions
Trace access is split deliberately, so you can let someone watch performance and spend without letting them read customer conversations.
| Permission | Grants |
|---|---|
| (none) | Your own runs, in full. |
trace: read | Widens the view to every run in the organization, but only the shape: who ran what, durations, token counts, cost, error types. |
trace: read_payloads | Additionally reveals the content: prompts, tool arguments, tool results, guardrail text and run input/output. |
Neither permission is needed to read your own traces. Requesting a run you cannot reach returns "not found" rather than "forbidden", so run identifiers cannot be probed.
The configuration snapshot
Every run stores a frozen copy of what the agent could do when it started: the model, the knowledge bases, the tools and whose accounts they used, the guardrail and its mode.
This is why a trace stays truthful. Edit the agent tomorrow and last week's trace still shows last week's setup.
Export
Any trace can be exported as a single structured document, for a ticket, an
incident review or a regulator. What it contains depends on your permissions:
without trace: read_payloads, the content fields are omitted.
Reading a trace: a worked example
Complaint: "The agent told a customer we offer a 60 day refund. We offer 30."
- Open Traces and find the run.
- Look at the retrieval step. Did it search the knowledge base at all?
- If it did, read what came back. Is the 60 day claim in one of the passages?
- Yes → a stale document is in the knowledge base. Delete or replace it.
- No → the model invented it. Tighten the instructions: "Answer only from the attached documents."
- Check the llm step for how much context it actually received.
- Check the guardrail step, if any, to see whether a check should have caught it.
Limits worth knowing
- Very large step payloads (a tool returning hundreds of kilobytes) are truncated, and the original size is recorded so you know it happened.
- There is a cap on the number of steps recorded per run. When a run hits it the trace is marked as truncated rather than silently shortened.
- Steps are written once and never changed.