

Usage
Where to find it
Sidebar → Usage. Pick a billing period from the selector at the top right.
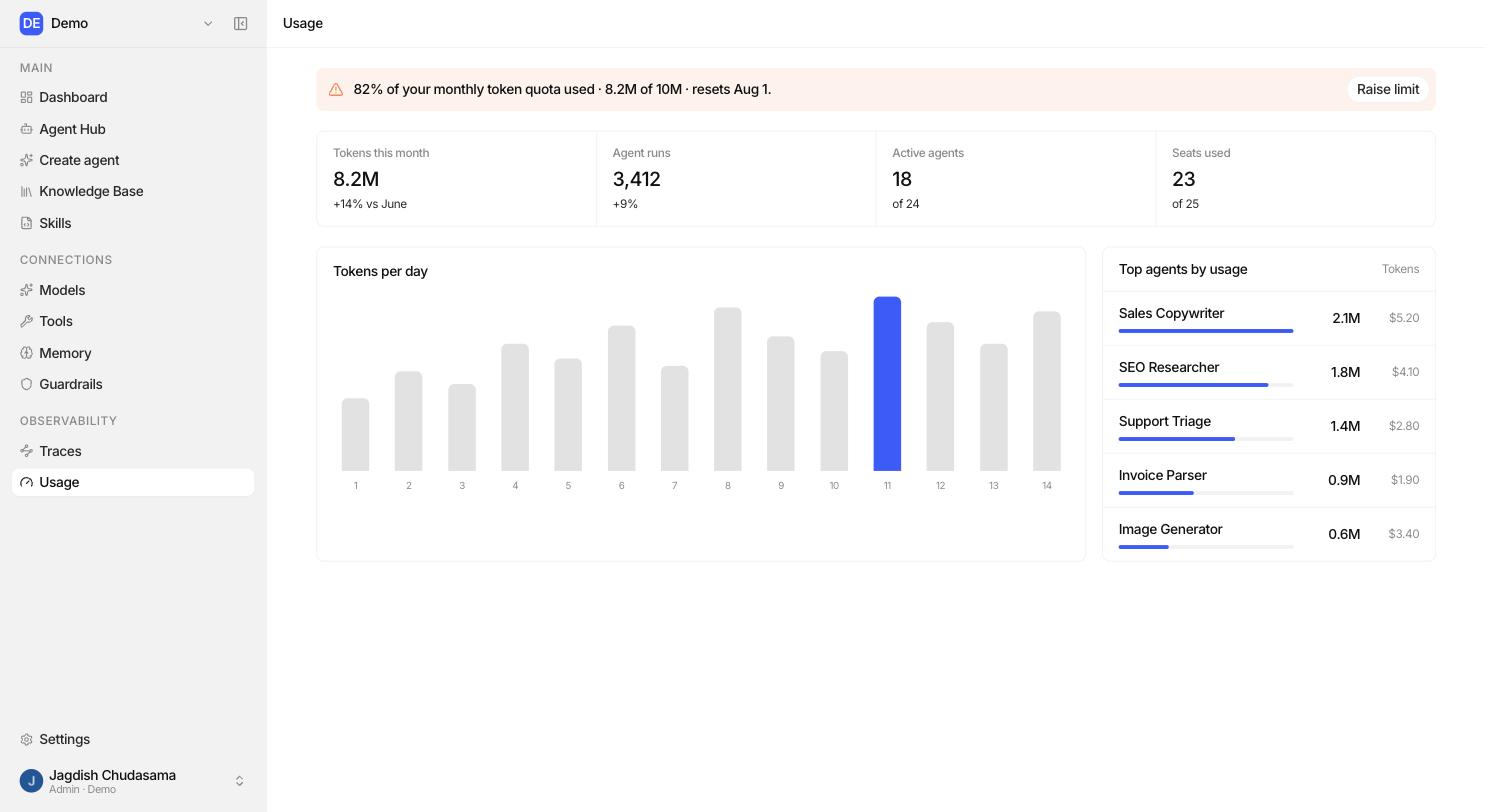
What the page shows
| Panel | Tells you |
|---|---|
| Period totals | Tokens and spend for the selected month. |
| Top agents | Which agents consume the most, ranked. |
| Trend | How consumption is moving period over period. |
Where the numbers come from
Every model step inside a run records four token counts and a cost figure:
| Measure | Meaning |
|---|---|
| Input tokens | What was sent to the model: instructions, history, retrieved passages. |
| Output tokens | What the model generated. |
| Cache read tokens | Reused from a cached prompt. Usually much cheaper. |
| Cache write tokens | Written into the cache for later reuse. |
| Cost (USD) | Recorded per step, to six decimal places. |
Because every member has their own gateway key, spend is attributable to the person who ran the agent, not just to the organization.
Bringing costs down
| Lever | Effect |
|---|---|
| Use a smaller model where quality allows | The single largest saving, usually by a wide margin. |
| Shorten instructions and skills | They are re sent on every single turn. |
| Attach fewer knowledge bases per agent | Each one adds retrieved passages to the input. |
| Cap output length in the instructions | Output tokens cost more than input tokens on most models. |
| Set a model allowlist | Stops expensive models being picked by default. See Model Gateway. |
| Look for retry loops in traces | A tool failing and retrying three times costs three times. |
Until Usage is live
Use Traces for accurate figures today:
- Open Traces.
- Filter to the period you care about.
- Read the per run token and cost columns.
Anyone with trace: read can do this across the whole organization without
being able to read conversation content.