On this page
A Note on What This Case Study Does and Does Not Claim
The other cases in this series lead with cost. This one does not, and the reason is worth stating plainly rather than dressing up.
There is no credible industry benchmark for how many additional laundering networks link analysis uncovers. Any vendor quoting one is quoting a number they cannot support. What can be evidenced is that a queue of alerts investigated one at a time is structurally blind to relationships that span alerts, and that the technical means to close that gap exists. The 35% to 50% time-to-detection improvement in this study is the target we commit to being measured against on the bank's own Phase 0 baseline. It is not a figure lifted from someone else's research.
So this case study makes an effectiveness argument, not a savings argument. The detection uplift is the pilot's measured deliverable, not our promise. In AML that distinction is not modesty. It is the only posture a second line of defense will respect.
At a Glance
| Metric | Before | After |
|---|---|---|
| Unit of investigation | The alert | The network |
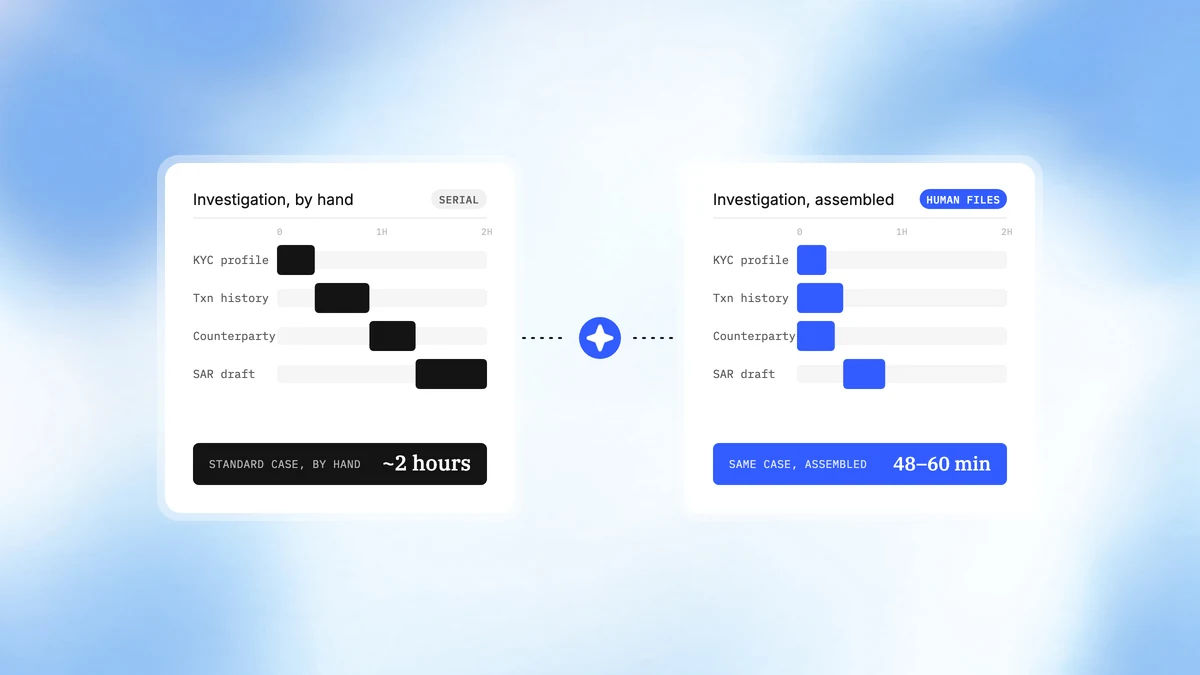
| Counterparty hypotheses per case | Chased serially, as time allowed | Chased in parallel, exhaustively |
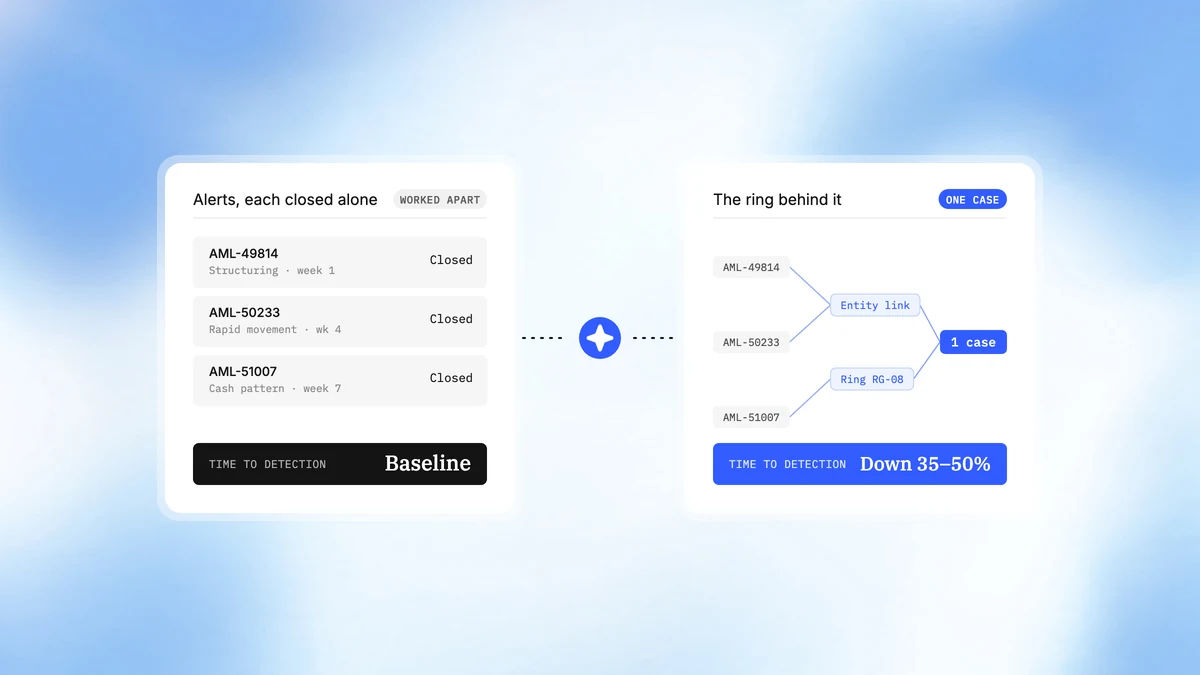
| Relationships spanning multiple alerts | Structurally invisible | Surfaced and resolved into a single case |
| Time to detection, genuine activity | Baseline | Down 35% to 50% |
| Catch rate | Baseline | No degradation, uplift measured in pilot rather than promised |
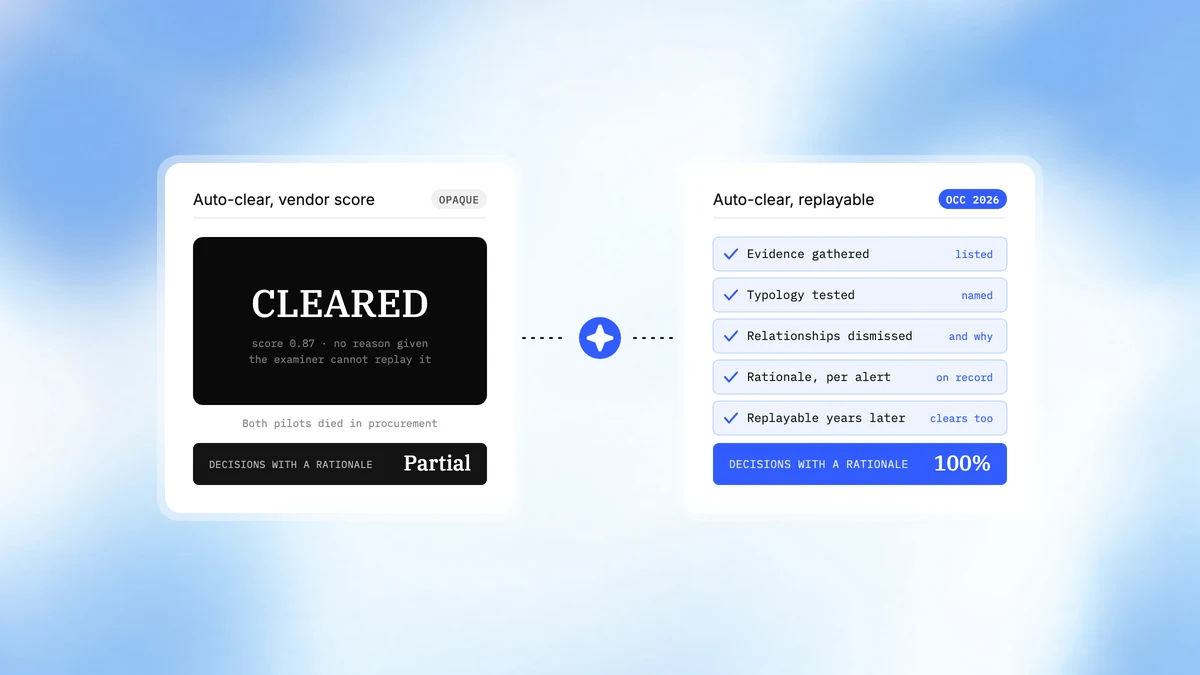
| Audit coverage | Partial | 100% of decisions replayable |
| Redundant investigations removed | N/A | ~2,500 per year (illustrative model, see below) |
Challenge
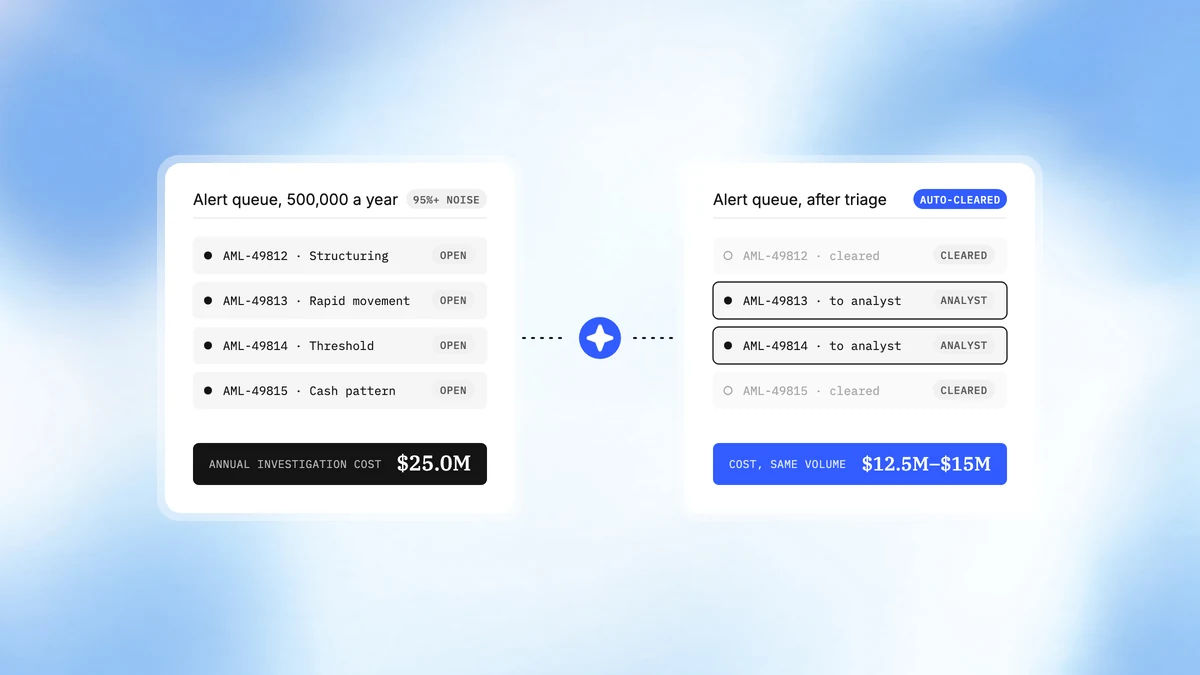
Roughly 500,000 alerts a year, about 25,000 escalating, each opened, worked, and closed on its own. That is the problem, and it is architectural rather than a resourcing one.
- An alert is one account at one moment. A laundering operation is almost never that. Mule networks, layering chains, and structuring rings are defined by their relationships, and relationships are exactly what a queue of individually-worked alerts cannot represent.
- The network is missed because nobody was ever shown it. The investigator sees account A. Account B sits elsewhere in the queue, worked by a different analyst three weeks later. Nothing in the process connects them.
- Chasing a wider web was punitively expensive. Each additional hop multiplied the work, so an investigator with a two-hour budget chases the one or two most obvious counterparties and stops. Not because the third was cleared, but because there was no time.
- The bank was deciding how far to look based on how busy it was. Investigative depth was a function of queue length rather than of risk.
- Time to detection stretched. A network is only recognised once enough of its members have independently surfaced, which can take months.
- The failure mode that produces consent orders. Global AML, KYC, sanctions, and due-diligence fines totalled $3.8 billion in 2025, with EMEA penalties up 767% year on year (Fenergo, Global AML Fines Research Report 2025). The actions that hurt are rarely about missing a transaction. They are about missing a pattern.
Solution
- The unit of investigation becomes the network. Link analysis across accounts, counterparties, and entities surfaces relationships a single-alert view cannot hold. Where a relationship spans alerts that would have been worked separately, weeks apart, the cases resolve into one.
- Every counterparty branch is chased at once. One configured investigation environment forks per hypothesis, so exhaustive analysis stops being combinatorially unaffordable and the bank stops setting depth by backlog.
- This is where the runtime is the product. An agent that reasons well about networks but runs on rented, serial infrastructure makes the same trade-off the human investigator made, for the same reason.
- The resolved network is classified against known typologies. And against the bank's own scenario library, so the investigator receives a network, its members, its money flows, its typology, and the reasoning.
- Analysis runs against transaction data inside a contained boundary. Each investigation in its own guest kernel, with egress allowlisted in the kernel so enrichment reaches approved adverse-media providers, watchlists, and registries and nothing else.
- The filing decision stays with the human. The agents assemble and explain. The person decides.
From one alert to a resolved network
- 01
An alert opens, as one account at one moment
Reads The alert itself, plus the accounts and entities around it
Emits Counterparty hypotheses, rather than a single case
- 02
Every hypothesis is chased at once
Reads One investigation environment, forked per branch
Emits Exhaustive depth, whatever the queue length that week
- 03
The network resolves into one case
Reads Relationships that spanned alerts other analysts held
Emits A ring presented as a ring, classified against typologies
- 04
An investigator decides whether to file
Reads The assembled network, and the relationships dismissed on the way
Held The filing decision, which stays with a person by design
Outcome Derived
This is an effectiveness argument rather than a savings argument, and detection uplift is the pilot's measured deliverable.
- Time to detection down 35% to 50%. A network that previously became visible only after enough members had independently tripped alerts is now surfaced from the first one.
- Investigative depth stops being a function of backlog. Every counterparty branch is chased on every case, whether the team is busy or not. Detection posture becomes a property of the system rather than of queue length in a given week.
- The ring is presented as a ring. Related alerts that would have been worked in isolation, by different analysts, weeks apart, arrive as one investigation with the relationships already drawn.
- 100% replayable, including dismissed relationships. Which were tested, which were dismissed, and why. OCC Bulletin 2026-13, issued 17 April 2026 with the Federal Reserve and the FDIC, replaced detailed model risk expectations with higher-level governance principles and left generative and agentic AI outside its scope. That puts the burden of explaining a network conclusion on the bank rather than on a rulebook.
- Regulatory exposure as context, not a promise. Fines totalled $3.8 billion in 2025, down from $4.6 billion in 2024 (Fenergo, Global AML Fines Research Report 2025), and single actions run into the hundreds of millions. We put no dollar figure on avoided penalties, because that number is unprovable and a serious risk officer will discount a business case that tries.
An Illustrative Model, Kept Separate from the Numbers Above
Presented as a model, not a benchmark. The assumptions are ours and a client should replace them with their own actuals.
If 15% of the bank's 25,000 escalated cases belong to networks averaging three linked alerts, then 3,750 alerts represent roughly 1,250 distinct networks. Investigating them as 1,250 network cases rather than 3,750 isolated ones removes about 2,500 redundant investigations a year. At two hours each and a fully loaded rate of $150 per hour, that is roughly 5,000 analyst hours and $0.75 million.
The illustrative model, term by term
25,000
Escalated cases a year
15%
Assumed to belong to a network
÷ 3
Average alerts per network
~1,250
Distinct networks, in place of 3,750 isolated alerts
The $0.75 million is not the point, and we would not lead a conversation with it. The point is the 1,250 networks that the single-alert view never saw as networks at all. The efficiency is a side effect of the effectiveness, and the effectiveness is the reason to do this.
What We Would Prove, and How
Detection effectiveness cannot be asserted. It has to be measured, and the measurement is the engagement.
Phase 0 establishes the bank's baseline: current time to detection, current SAR volume, and, critically, a retrospective sample. We run the network agent across a closed historical period the bank has already worked and compare what it surfaces against what the human team found at the time. This is the honest test, because the ground truth already exists and neither side can argue with it.
Shadow mode follows, with the agents running network analysis in parallel with the live human team and making no binding decisions. Agent-surfaced networks are reviewed by the bank's investigators, who decide whether each is real. Go-live is gated on that review.
Success criteria, agreed up front against the Phase 0 baseline: time to detection down at least 35%, no degradation in catch rate, network relationships surfaced in the retrospective sample that the manual process did not find, and 100% audit coverage of every decision including the reasoning behind dismissed relationships.
Investigating the Network, Not One Alert at a Time
We are content for it to.
Methodology and Sources
The bank in this study is an illustrative composite built on a stated mid-size profile of 500,000 annual alerts at an assumed 95% false-positive rate, yielding roughly 25,000 escalated investigations. The 95% is an assumption, not a published benchmark. Trade reporting puts rules-based transaction monitoring false-positive rates above 90%, and we replace the assumption with the client's actuals in Phase 0.
The 35% to 50% time-to-detection improvement is our own target, agreed against the bank's Phase 0 baseline and measured in the pilot. It is not drawn from any third-party benchmark. The 2025 fines figure of $3.8 billion, the $4.6 billion prior year, and the regional enforcement shift come from Fenergo's Global AML Fines Research Report 2025, at resources.fenergo.com. The April 2026 model risk changes are OCC Bulletin 2026-13, issued jointly with the Federal Reserve and the FDIC on 17 April 2026, at occ.gov.
The network consolidation model in the separated section above rests on two assumptions that are ours and are not sourced: that 15% of escalated cases belong to a network, and that such networks average three linked alerts. Both are stated so a client can replace them. No industry benchmark for detection uplift from link analysis is cited anywhere in this document, because we are not aware of one that would survive scrutiny.
Sources: Fenergo (Global AML Fines Research Report 2025), OCC (Bulletin 2026-13, Model Risk Management: Revised Guidance, 17 April 2026), FinCEN (SAR FAQs, 9 October 2025).
Highlights
- Time to detection on genuine activity down 35% to 50%, measured against the bank's Phase 0 baseline.
- Unit of investigation changes from the alert to the network.
- Counterparty hypotheses chased in parallel, exhaustively, instead of serially as time allows.
- 100% of decisions replayable, including network reasoning: which relationships were tested, dismissed, and why.
- Effectiveness argument, not a savings argument. Detection uplift is the pilot's measured deliverable.