On this page
Time-to-decision, consumer: hours for in-policy cases
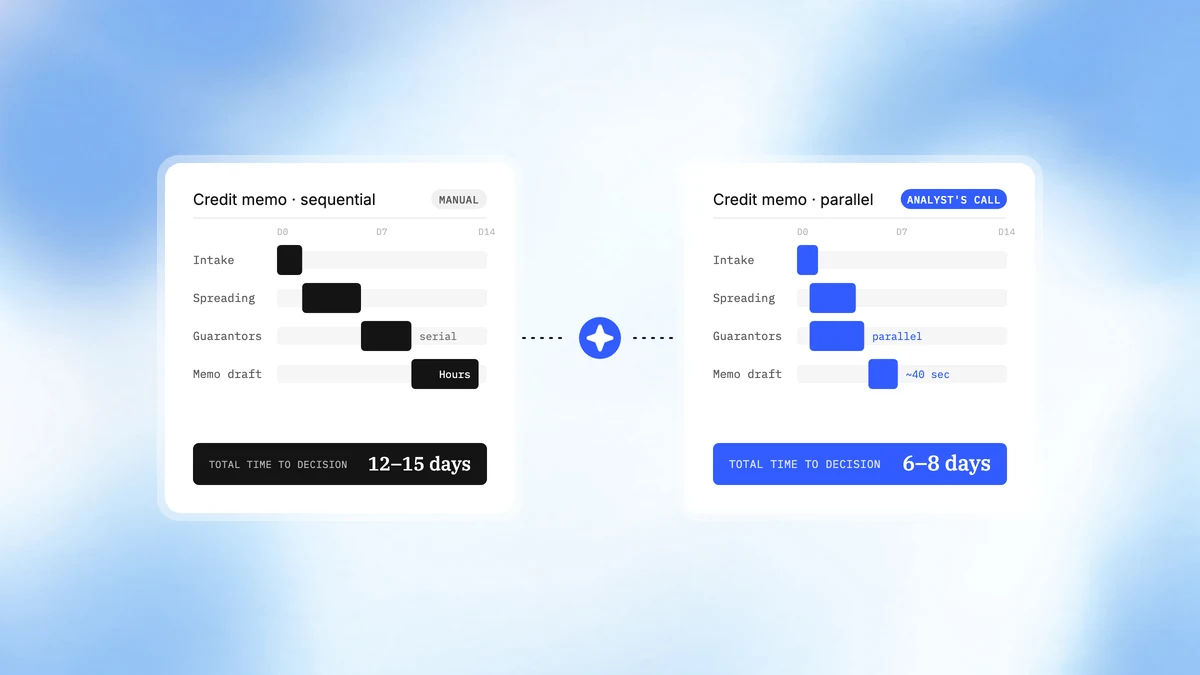
Time-to-decision, commercial: 6 to 8 days, falling with confidence
Time-to-decision, overall: down 40% to 50%
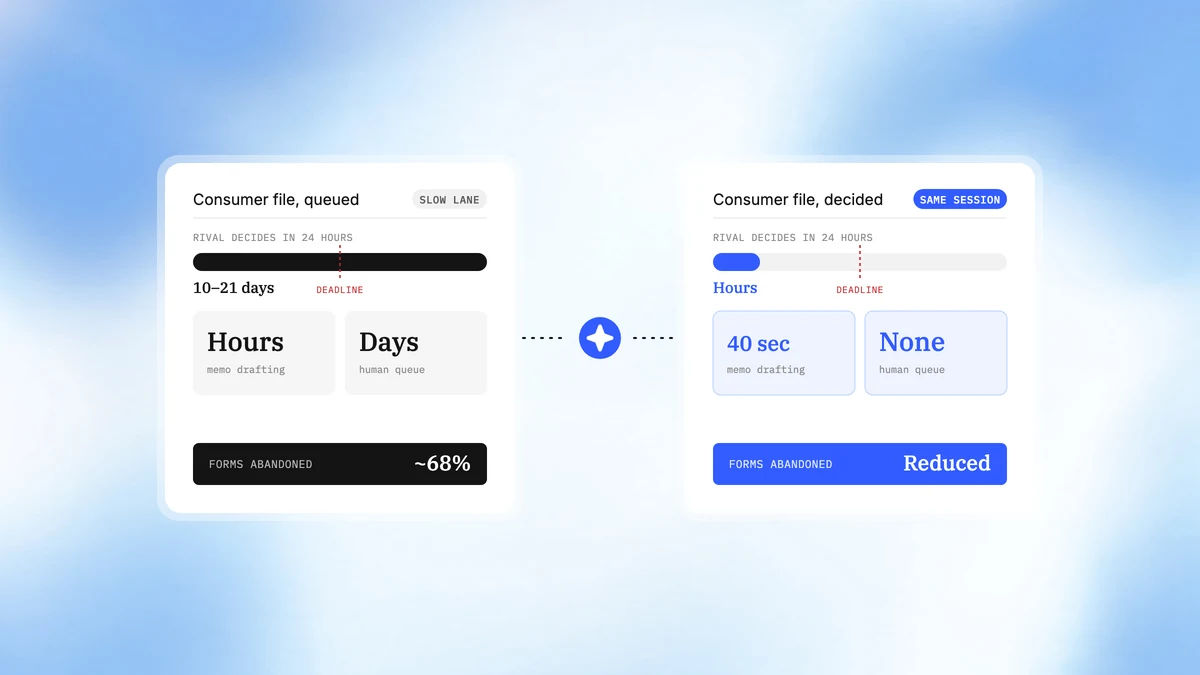
Credit-memo drafting: ~40 seconds document-to-draft
Challenge
Every other use case in banking is a cost-centre story, where success means doing the same work for less money. Lending is the exception, and the bank is losing the applications it most wants to win for reasons that have nothing to do with credit.
- 68% of European consumers have abandoned a financial-services application. Not been declined. Abandoned. They started and then left (Signicat, The Battle to Onboard, 2022, up from 63% two years earlier).
- They leave after an average of under nineteen minutes. Eighteen minutes and fifty-three seconds, on the same research, down from twenty-six minutes in 2020. That is not a considered decision to bank elsewhere. It is someone deciding the form is too long, the upload too clumsy, or the wait too vague, and closing the tab.
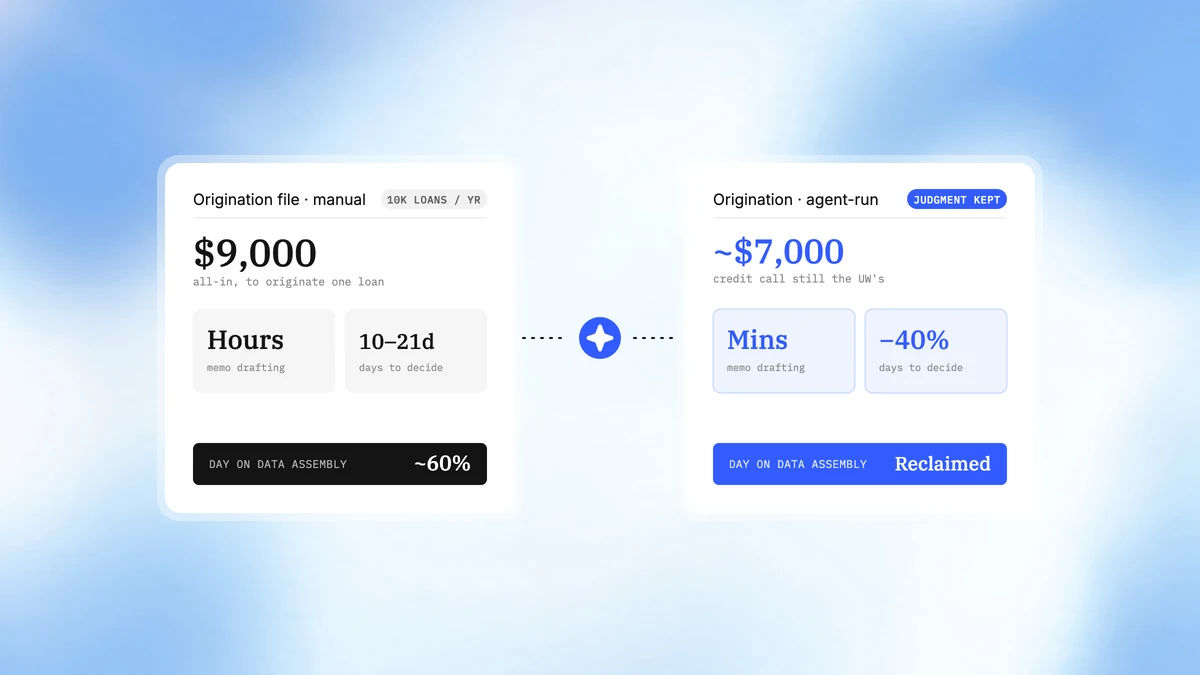
- The second leak is slower and quieter. Manual underwriting runs 10 to 21 days against the 24 to 72 hours an automated path takes, and commercial cycles routinely run into a second week.
- In a market where a rival decisions in 24 hours, that is market share. Every one of those days is a day the applicant sits with an unanswered question, and increasingly a day a competitor answers it.
- The delay is queueing, not difficulty. A clean, in-policy, low-risk application sits in the same human queue as a complex one, while an underwriter spends about 60% of the day on data assembly rather than credit judgment.
- The simplest customers wait longest relative to their complexity. And they are precisely the ones most likely to leave, because they have the most options.
Two clocks, running on the same application
The applicant's clock
The bank's clock
The form is opened
The form is opened
Attention holds for 18m 53s
Nothing has happened yet
The applicant leaves
The application enters a queue
68% abandon at some point
A clean file queues behind a complex one
They apply somewhere else
Manual underwriting runs
A rival decisions in 24 hours
10 to 21 days
Already a customer elsewhere
The decision is ready
The offer arrives too late to matter
In-policy, and it would have been a yes
Solution
CreateOS builds, deploys, and operates an agent workforce inside the bank's own environment. Not a platform handed over for the bank's team to run, and not a SaaS product the applicant's financial data has to travel to. We build the agents, integrate them to the origination stack, run them on infrastructure we own that sits inside the bank's boundary, and operate them against the bank's own credit policy.
The crew that closes the speed gap:
Orchestrator and intake
Receives the application the moment it lands, opens an isolated case environment, and applies credit policy to route it straight-through, escalate, or hold. Nothing sits in a queue waiting for a person to pick it up.
Document processing and spreading
Extracts and spreads income, tax returns, bank statements, and financials in minutes rather than hours, and tells the applicant immediately if something is missing rather than three days later.
Data gathering and enrichment
Pulls credit bureau, banking, and approved third-party data in parallel with extraction, not after it.
Credit analysis and risk scoring
Assesses against the bank's own models and policy, producing the score and the factors behind it.
Credit-memo drafting
Generates the memo and decision rationale in the bank's format. Document-to-draft runs in roughly 40 seconds.
Policy and fair lending, and explainability
Prepares regulation-compliant adverse-action reasons on any decline and logs the full decision chain, because a fast decision that cannot be explained is a liability, not a win.
In-policy applications come back decision-ready in hours. Everything else reaches an underwriter with the case already built and the open questions surfaced, so human time is spent on the files that actually need a human.
The Part That Actually Creates the Speed
Most vendors sell "AI underwriting" and deliver a faster step inside a process that is still fundamentally a queue. The speed comes from the infrastructure, and it is the layer most agent vendors rent and cannot control.
Fork per applicant. One configured underwriting environment, baked as a template, forks per application. Every case is evaluated in its own isolated, identical copy. The bank's full application volume runs in parallel rather than backing up behind the slowest file. This is what breaks the queue, and breaking the queue is the whole point: the clean applicant no longer waits for the complicated one.
Pause and resume. Applications waiting on a missing document or on a human underwriter are paused rather than left burning compute. Waiting costs the bank nothing, so there is no economic pressure to batch, and batching is what creates the multi-day wait in the first place.
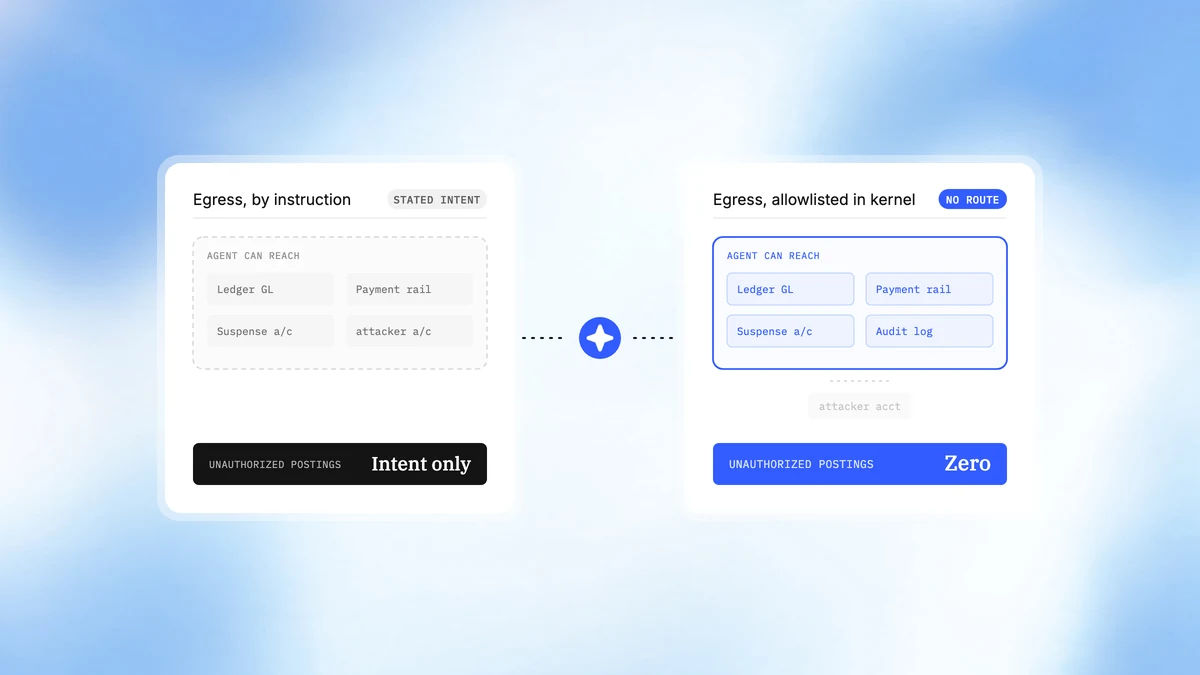
Per-VM kernel isolation. Every case runs in a Firecracker micro-VM with its own guest kernel, so extraction runs against applicant financials inside a contained boundary and a malicious upload is confined to a disposable machine.
Kernel-level egress governance. Outbound access is allowlisted in the kernel with eBPF. The enrichment agent reaches the approved bureaus and nothing else. Applicant data cannot leave, because the path does not exist.
Full self-hosting and data residency. Control plane and storage run inside the bank's infrastructure and region, which keeps the credit model documented, validatable, and legally the bank's own.
CreateOS is SOC 2 Type II and ISO 27001 certified.
Outcome Derived
Take a mid-size bank originating 10,000 loans a year. Applying the benchmarked 2025 and 2026 ranges to that baseline:
| Metric | Before | After |
|---|---|---|
| Time-to-decision, consumer | 10 to 21 days | Hours for in-policy cases |
| Time-to-decision, commercial | 12 to 15 days | 6 to 8 days, falling with confidence |
| Time-to-decision, overall | Baseline | Down 40% to 50% |
| Credit-memo drafting | Hours | ~40 seconds document-to-draft |
| Application abandonment | ~68% | Reduced through speed and responsiveness |
| Underwriter productivity | Baseline | Up 20% to 40% submissions per head |
| Adverse-action coverage | Inconsistent | 100% explainable and replayable |
- The recovered-application lever is what makes lending different. Recover even 10% of the applications lost to a slow or clumsy process and a 10,000-loan base gains roughly 1,000 funded loans a year. Not 1,000 leads: 1,000 booked loans, from demand already paid for and lost at the counter.
- What they are worth is the bank's own arithmetic, and it should be. Two inputs set it, average loan size and net contribution per loan. At an assumed 0.8% origination fee, replaced with the bank's actuals in Phase 0, before any lifetime interest margin:
| Average loan size | Origination fee per loan (0.8%) | 1,000 recovered loans |
|---|---|---|
| $50,000 | $400 | $0.4M |
| $150,000 | $1,200 | $1.2M |
| $300,000 | $2,400 | $2.4M |
- That is the fee line only. Add net interest margin over the life of the book and the recovered revenue typically clears the cost saving from the same deployment.
- We quote no third-party uplift figure here. The approval-uplift numbers circulating in this market are vendor claims with no traceable study behind them, so we do not repeat them. Your recovery rate is measured on your own funnel in Phase 0, not asserted in a first meeting.
- The cost line comes with it. The same deployment reclaims the 60% of underwriter time lost to data assembly, taking all-in cost to originate from roughly $9,000 down 15% to 22%. Speed and cost are not a trade here.
What We Would Prove, and How
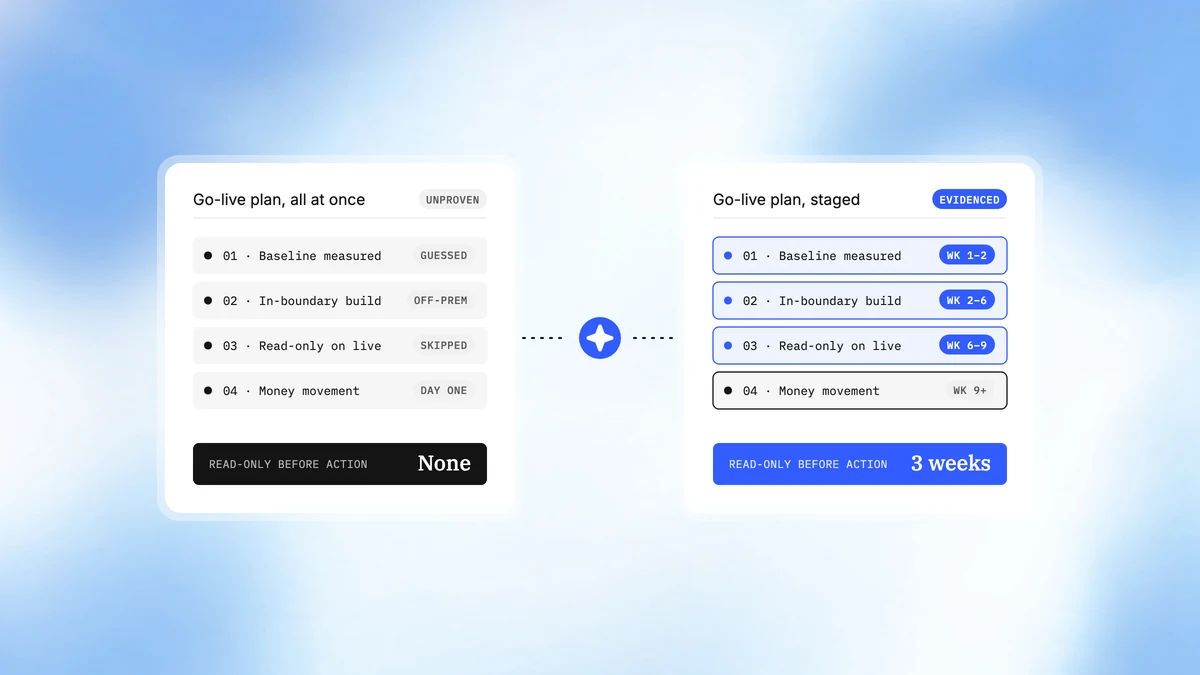
Phase 0, weeks 1 to 2. We measure the bank's actual abandonment rate, time-to-decision, cost to originate, underwriter throughput, and where in the funnel applicants are actually dropping. That last one usually surprises people, and it becomes the contract's yardstick.
Phase 1, weeks 2 to 6. Stand up the crew, integrate to the origination system, bureaus, banking-data providers, and document store along allowlisted paths, encode the credit policy, deploy self-hosted inside the boundary.
Phase 2, weeks 6 to 10. Champion-challenger shadow run. Agents underwrite real applications alongside human underwriters, binding nothing. We compare case by case and test explicitly for disparate impact before anything goes live.
Phase 3, weeks 10 onward. Controlled go-live on the cleanest in-policy segments first, humans on every decline and every exception, scope widening as the evidence builds.
Success criteria, agreed against the Phase 0 baseline: time-to-decision down at least 40%, measurable reduction in abandonment, cost per loan down at least 15%, underwriter throughput up at least 20%, no degradation in default rate, no disparate impact, and 100% explainable adverse-action coverage.
Highlights
- Roughly 1,000 additional funded loans a year on a 10,000-loan base, if the bank recovers even 10% of the applications it loses to a slow or clumsy process. Not 1,000 more leads: 1,000 more booked loans, from demand already paid for and then lost at the counter.
- Time-to-decision down 40% to 50%, with in-policy consumer cases answered in hours instead of 10 to 21 days.
- What those loans are worth is the bank's own arithmetic, set by average loan size and net contribution per loan. At an assumed 0.8% origination fee, 1,000 recovered loans is $0.4M to $2.4M before any lifetime interest margin.
- That is the fee line only. Add net interest margin over the life of the book and the recovered-revenue figure typically clears the cost saving from the same deployment. We quote no third-party uplift figure here, because the ones in circulation are vendor claims with no traceable study behind them. Your recovery rate is a number we measure on your funnel in Phase 0, not one we assert in a first meeting.
- And the cost line comes with it. The same crew that closes the speed gap reclaims the 60% of underwriter time lost to data assembly, taking the all-in cost to originate from roughly $9,000 down 15% to 22%. Speed and cost are not a trade here. They are the same deployment.