Underwriter time on non-underwriting work, materially reversed.
Underwriter admin burden, up to 52%.
Annual cost reduction on underwriting operations.
Quote capacity, same team.
Challenge
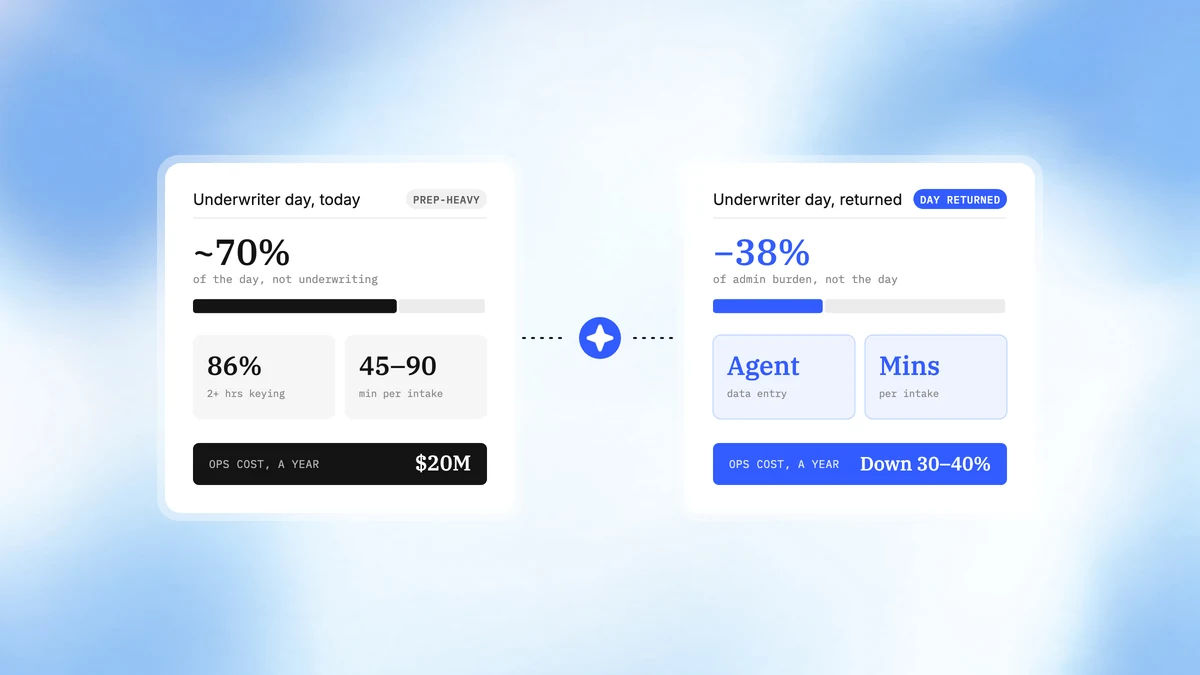
Their judgment on which risks to take and how to price them was the entire business, and roughly 70% of the day went elsewhere (Accenture, P&C underwriting survey with The Institutes, 2022). The carrier ran the numbers on its own team and found the same thing.
- 86% spent more than two hours a day on manual data entry. With intake review on a mid-complexity commercial submission taking 45 to 90 minutes before anyone started thinking about the risk.
- $7.2M to $14.4M a year on intake alone. Somewhere between 72,000 and 144,000 hours across the team, at a fully loaded rate of roughly $100 an hour, done by the most expensive and hardest-to-replace employees in the building.
- Underwriters were the bottleneck on growth. The carrier could not write more business without hiring more of them, in a market where experienced commercial underwriters are scarce and expensive.
- Senior people were leaving for the job they trained for. And the underwriting itself suffered, because an expert who spends six hours a day on data entry is not an expert thinking hard about the seventh.
- Headcount and offshore intake moved the cost, not the constraint. The handoffs, the rekeying, and the chase cycles stayed exactly where they were.
The underwriter's day
- 70%
Goes to non-underwriting work
40% administrative, 30% negotiation and sales support.
- 86%
Do 2+ hours of data entry daily
Before any judgement happens, on a separate survey that matched the carrier's own numbers.
- 38-52%
Off the admin burden
38% is the committed floor. The upper end is modelled, not promised.
Solution
CreateOS built and deployed an agent crew that does the intake, so the underwriter does the underwriting.
86% spend more than two hours a day on manual data entry alone (hyperexponential, 2024).
The only part the carrier pays a premium for.
The carrier had been paying for a hundred underwriters and getting the underwriting output of roughly thirty. A 38% cut in admin burden hands back 27,000 to 55,000 hours, the equivalent of 14 to 27 underwriters.
The submission arrives from the broker the same way it always did. What changes is who opens it.
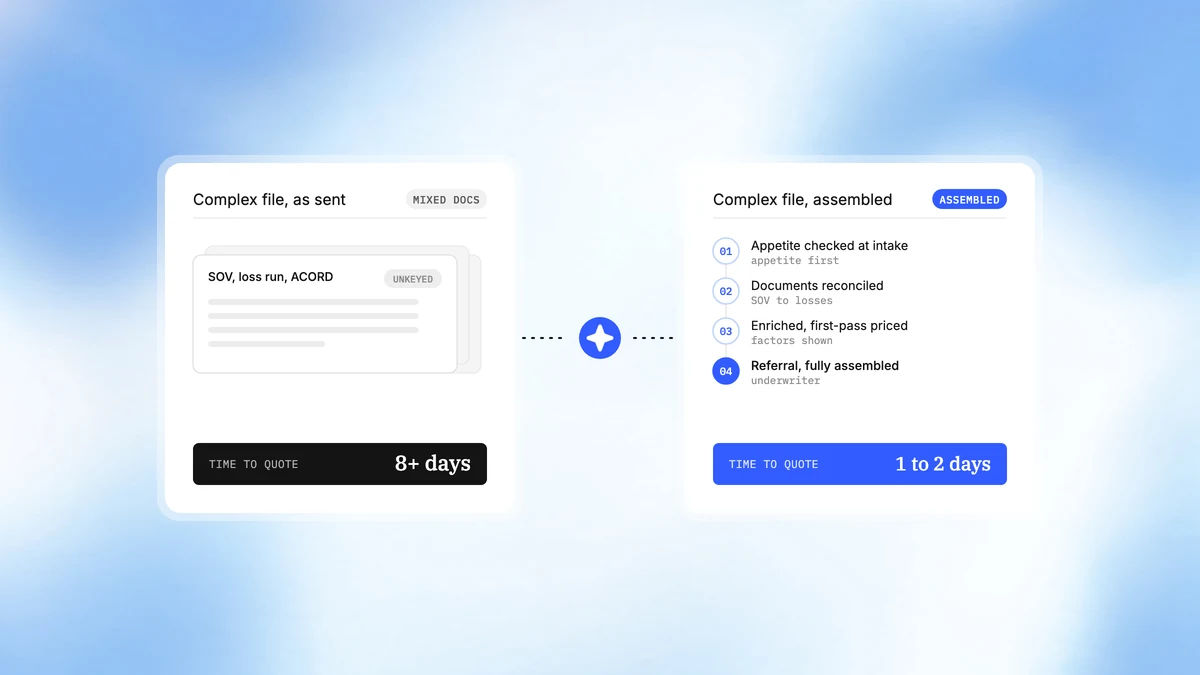
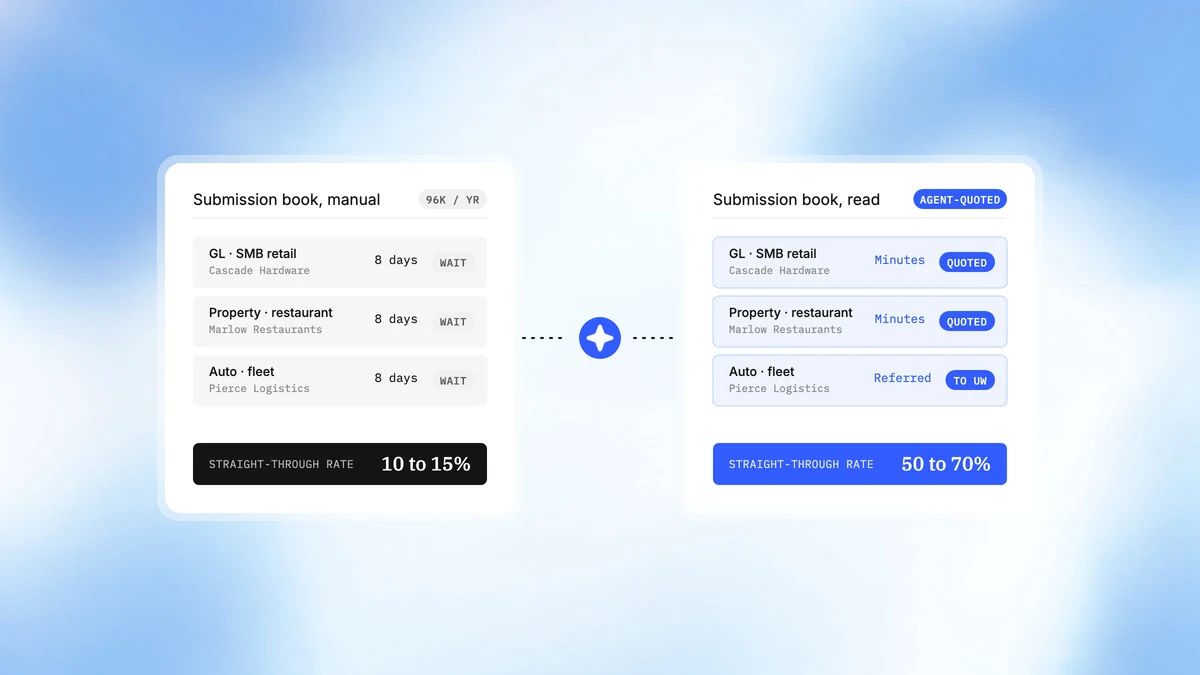
- Appetite is applied before an underwriter spends a minute. Straight-through, refer, or decline-to-quote is settled at intake, with the reason written.
- The broker email and everything attached to it is read. ACORD forms, loss runs, schedules of values, financials, classified and normalised into the carrier's own fields. Untrusted attachments are handled in the most tightly contained environment in the system.
- Enrichment removes the second-largest time sink. Approved third-party property, hazard, financial, and prior-claims providers complete the picture.
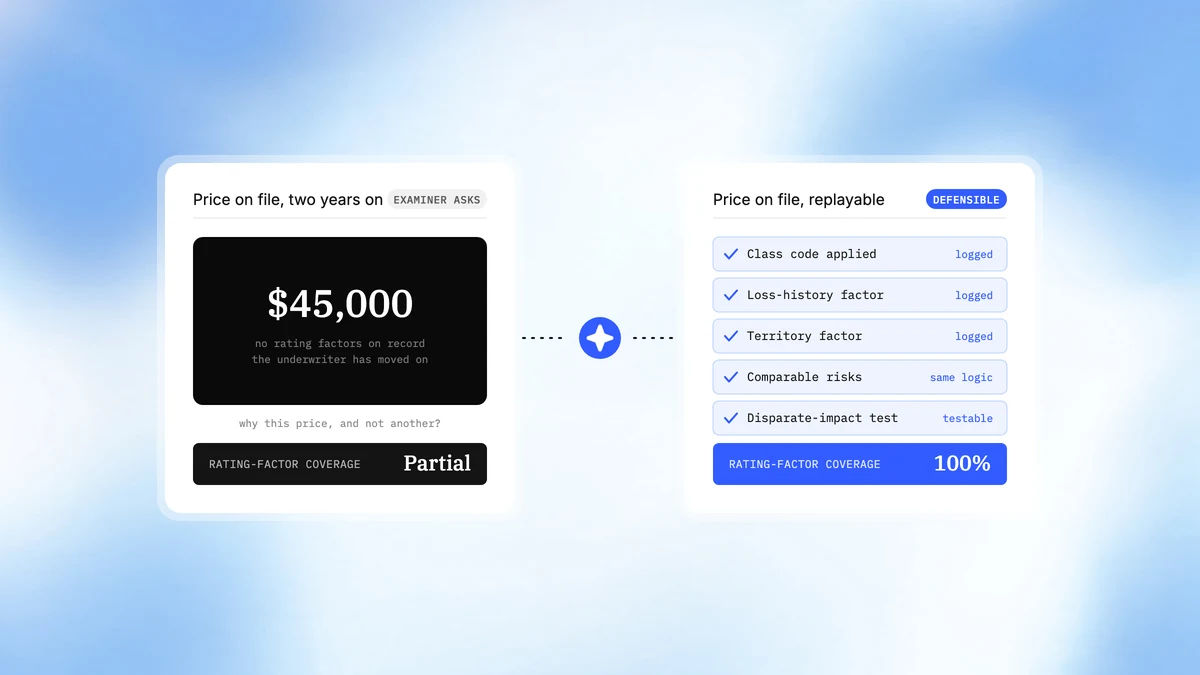
- A first-pass price with the rating factors exposed. Against the carrier's own filed rates, with referral reasons written where the risk falls outside guidelines.
- The underwriter's first action is a decision. What lands on the desk is a submission already read, extracted, enriched, appetite-checked, and priced, with the missing information chased and the open questions flagged. Not an email with attachments.
- Full volume processes in parallel. Each submission forks into its own isolated environment instead of queueing behind whoever is free, and anything waiting on a broker's missing loss run pauses rather than consuming compute.
- Pricing models and policyholder data never leave. Control plane and storage run inside the carrier's own infrastructure, with egress allowlisted in the kernel to approved data providers and nothing else.
CreateOS is SOC 2 Type II and ISO 27001 certified.
Outcome Derived
The underwriters got their day back.
| Metric | Before | After |
|---|---|---|
| Underwriter time on non-underwriting work | ~70% | Materially reversed |
| Underwriters doing 2+ hours daily data entry | 86% | Agent-handled |
| Intake review per submission | 45 to 90 minutes | Minutes, agent-handled |
| Underwriter admin burden | Baseline | Down 38%, up to 52% |
| Quote capacity, same team | Baseline | Up 25% to 40% |
| Underwriting operations cost | $20M | Down 30% to 40% |
| Underwriting expense ratio | Above target band | Toward the 20% to 30% band |
| Audit coverage | Partial | 100% of decisions logged |
- $6.0M to $8.0M a year, the number to write into a contract. 30% on the $20M line is the conservative floor we commit to in a pilot; 40% is the figure reported in production deployments.
- 27,000 to 55,000 hours back, or 14 to 27 underwriters. Intake was consuming 72,000 to 144,000 hours a year, and a 38% admin-burden reduction hands that back without a new hire and without losing anyone from the team.
- The agents give back the underwriters already being paid for. The carrier had been paying for a hundred and getting the output of roughly thirty. The agents do not replace the seventy.
- 24,000 to 38,400 more submissions a year. A carrier that declined to quote because the desk was full can now quote. One that lost accounts to whoever came back first can now come back first. A growth lever wearing an efficiency lever's clothes.
- 70% does not become 0%, and we do not claim it. Underwriters still chase a broker, argue a referral, and handle the account the agent could not read. The credible claim is that the largest, most mechanical block comes off the desk, which is what the 38% to 52% measures.
- No claim about the loss ratio. Better-supported decisions do improve it, and that prize is larger than everything above, but it gets validated on the carrier's own book in champion-challenger testing first.
What We Would Prove, and How
Weeks 1 to 2, baseline. Measure where the underwriters' hours actually go, the intake time per submission, the current straight-through rate, and the expense ratio on the target line. This becomes the contract's yardstick.
Weeks 2 to 6, build and integrate. Stand up the agent crew, integrate to the carrier's policy administration, rating engine, document intake, and approved data providers along allowlisted paths, encode appetite and filed rates, deploy self-hosted inside the carrier's boundary.
Weeks 6 to 10, champion-challenger shadow run. Agents extract, enrich, and price real submissions alongside the underwriters without binding anything. Compare case by case, measure the hours actually returned, and test explicitly for unfair and proxy discrimination before anything goes live.
Week 10 onward, controlled go-live. Agent intake switched on across the standard book first, underwriters on every referral and decline, scope expanding as the evidence builds.
Success criteria, agreed up front: underwriter admin burden down at least 38%, quote capacity up at least 25%, time to quote down at least 40%, no degradation in loss ratio, and 100% explainable rating-factor coverage.
Highlights
- Underwriter time on non-underwriting work: ~70% → Materially reversed.
- Underwriter admin burden: down 38%, up to 52%.
- Annual cost reduction on underwriting operations: $6.0M to $8.0M.
- Quote capacity, same team: up 25% to 40%.
Frequently asked questions
What does underwriting automation actually take off the underwriter's desk?
Intake. The broker email and everything attached to it is read, classified, and normalised into the carrier's own fields. Enrichment from approved third-party providers completes the picture, appetite is applied, and a first-pass price is produced against the carrier's filed rates. What lands on the desk is a submission already read, enriched, appetite-checked, and priced.
Does underwriting automation take the pricing decision away from the underwriter?
No. The agent produces a first-pass price with the rating factors exposed, and writes the referral reason where a risk falls outside guidelines. Underwriters stay on every referral and every decline. The claim is that the largest and most mechanical block comes off the desk, not that the underwriter comes off the decision.
Does the 70% of the day spent on non-underwriting work go to zero?
No, and this blueprint does not claim it. Underwriters still chase a broker, argue a referral, and handle the account the agent could not read. The credible modelled claim is a 38% to 52% cut in admin burden, which hands back 27,000 to 55,000 hours on a team spending 72,000 to 144,000 hours a year on intake.
What does this claim about the loss ratio?
Nothing. Better-supported decisions do improve loss ratio, and that prize is larger than the cost and capacity figures, but it is validated on the carrier's own book in champion-challenger testing before anyone attaches a number to it. The same shadow run tests explicitly for unfair and proxy discrimination before anything goes live.
How is the capacity gain proved rather than asserted?
Weeks one and two measure where the underwriters' hours actually go, intake time per submission, the current straight-through rate, and the expense ratio on the target line. That baseline becomes the contract's yardstick. Success criteria agreed up front include quote capacity up at least 25% and time to quote down at least 40%.